DevTools2024
API Performance Profiler
A lightweight Node.js middleware and CLI that profiles real API requests and replays them under load.
Overview
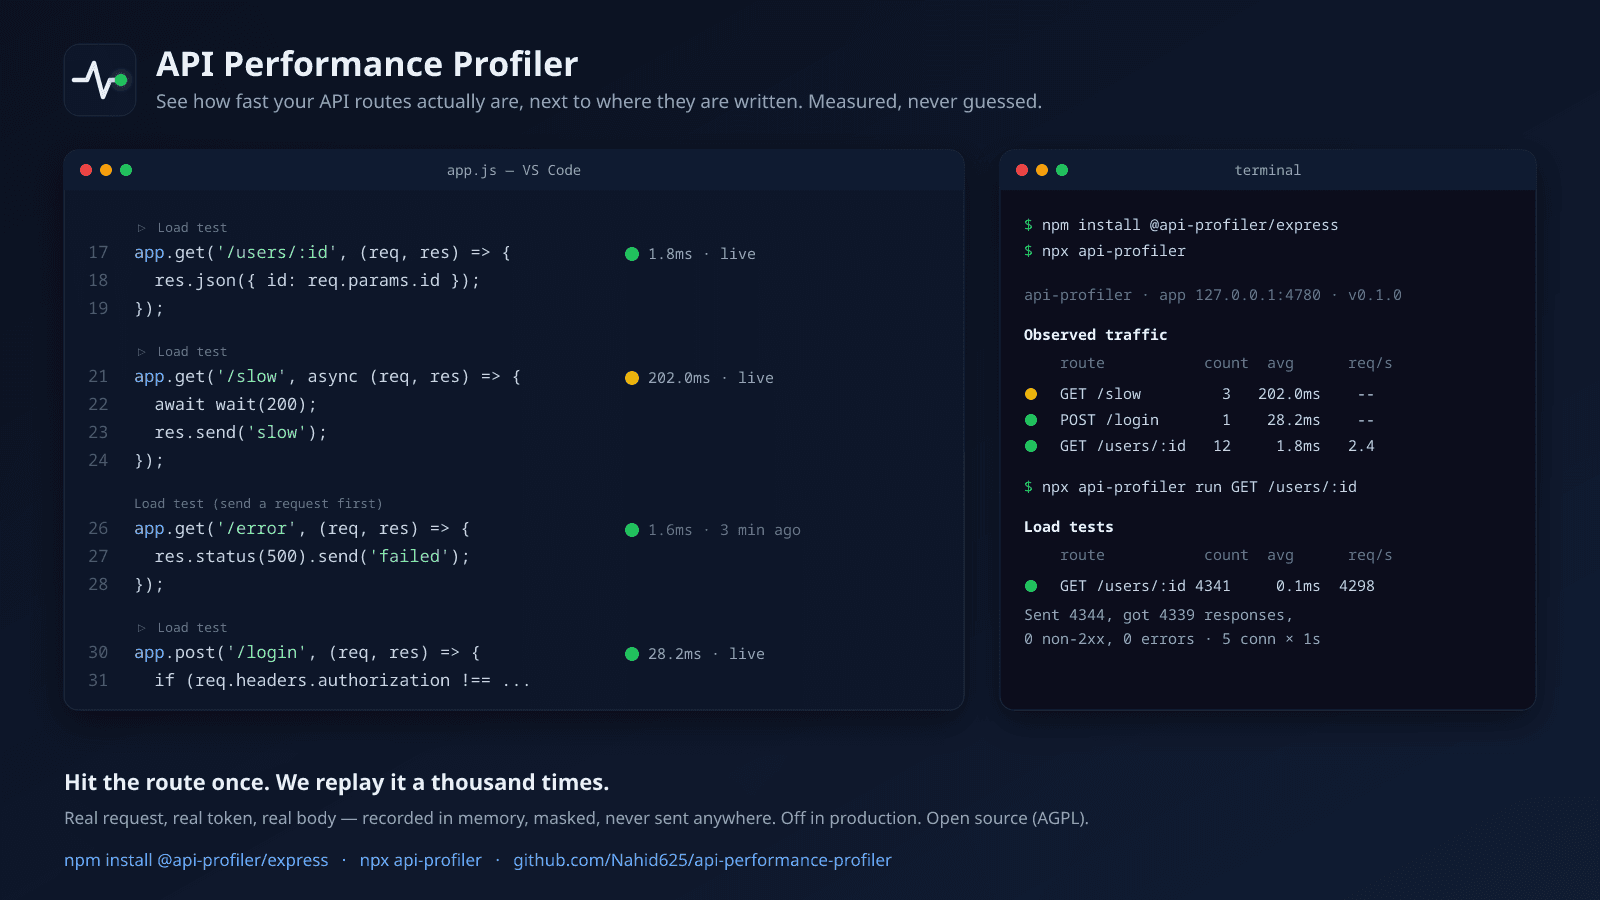
Designed to prevent context switching, this profiler runs as an Express middleware or NestJS interceptor. It records actual requests (including working tokens and bodies) in memory, allowing developers to replay them a thousand times to measure accurate latency and error rates right in the terminal or VS Code.
The Problem
Developers have to leave their editor and use external tools like Postman or JMeter to load-test and profile API latency.
The Solution
Built a seamless in-memory recording mechanism that captures the first real request and provides a local channel to replay it under load instantly, providing metrics where developers already are.
Technologies
TypeScriptNode.jsExpressNestJSVS Code API
Key Highlights
- Zero-config Express/NestJS middleware
- Real request token/body recording
- Local JSON channel for CLI/VS Code
- Automatic production disablement